
Stability Rates of Cricket Statistics

Introduction
In this article, we will determine how quickly various cricket statistics become reliable indicators of true performance-if they can be reliable indicators at all. This is essentially an effort to answer the question of "what sample size do I need before I can say this player is good?" We'll focus on T201 stats here, given the volume of data and regular cadence of top-level leagues going throughout the year.
On the whole, cricket is a sport with unusually high levels of variability and random chance. Entire seasons can be made up of as few as 5 matches (Major League Cricket) or just 14 even for the world's biggest league, the IPL. The defining moments of a cricket match-wickets and sixes-each have only a ~5% probability of occurring for each ball. The distribution of run scoring is lumpy-most of the time you score 0 or 1, maybe 2, and then you get 4s and the occasional 6, skipping over 3 and 5 entirely. Even the very field you play on has outsized influence on scoring patterns, with different grounds carrying significantly different scoring environments, and even the same grounds playing differently depending on pitch preparation and overhead conditions. Down to a single individual match, scoring patterns are significantly different at the start of an innings or at the end, and varies depending on how many wickets you have in hand.
All of this is to say-can cricket stats ever be trusted? How much of a player do we have to see to be able to say we have a good feel for their talent level? Let's find out!
Acknowledgements
Before I dive in, I'd be negligent to not mention the giant shoulders of the sabermetric community in baseball that this analysis rests upon. This link from FanGraphs (a website still with no equal in the cricket community) gives an overview of this type of analysis in the baseball sphere, with several links for further reading.
We also need to give mad props to Cricsheet-dot-org for providing ball-by-ball data for every cricket match you could possibly want-for free. It truly is the most important resource for the cricket statistics community.
Methodology
Again, the ultimate question we're trying to answer is how much information can we really take from a player's stats over a given the volume of their playing time, which here we will define as balls faced while batting or balls bowled while bowling. The methodology is fairly straight-forward: If we want to test the reliability of batting Strike Rate (SR) after 200 balls faced, we take a sample of players who have faced at least 400 balls and check how well their SR compares in the first 200 balls they faced to the next 200 balls they faced.
A few definitions:
Correlation is a measure of the strength of a relationship between two variables and goes between 0 and 1. Close to 0 means no relationship, close to 1 means a strong relationship.
R-Squared is simply correlation squared, and can be interpreted as "variable A explains xx% of the variation in variable B".
Stability is loosely defined as having a correlation of > 0.7, which gives you an r-squared value of > 0.7*0.7=0.49, or in other words-about half of the variability in one sample can be explained by the other sample. In cricket terms, this means past performance in a given stat can explain a good chunk of variability in future performance for a given stat. (i.e., that stat is "stable" or "reliable").
Details on how we're actually taking these samples: To protect against wildly varying conditions and quality of opposition-and to ensure sufficient sample sizes, samples are in 2-year chunks within major domestic T20 leagues. The two-year chunks are 2016-17, 2018-19, 2020-21 and 2022-23, and the leagues covered include the IPL, PSL, BBL, CPL, Blast and Super Smash.
For both batting and bowling, sample sizes will vary from 50 balls faced/bowled up to 550 balls faced/bowled. For each sample size for a given statistic, we take players who faced or bowled the minimum number of balls within each league and two-year chunk, and calculate the correlation between the first half of that data and the second half2, so we can determine if the first half of data holds any predictive value for the second half of that data.
Stats to Measure
Here's a run-through of the stats we'll measure:
Batting
Average (Avg): Average number of runs scored per wicket lost. (Sort of) measures how many runs a player scores per inning, giving extra credit if they end an inning "not out".
Strike Rate (SR): Runs scored per 100 balls (Runs / Balls * 100). Measures "scoring speed" for a batter.
Non-Boundary Strike Rate (NBSR): Strike rate, but excluding boundary balls. Measures a batter's ability to take ones and twos, their speed between the wickets and ability to rotate the strike.
Balls per Wicket (BPW): Average number of balls faced per wicket lost. Measures how well a player avoids getting out.
Boundary Percent (BND): Percentage of balls hit for a 4 or a 6. Measures a batter's "power".
Sixes Percent (6PCT): Percentage of balls hit for a 6. One of the few "true outcomes" of cricket, given that a six is independent of field settings or fielder quality, unlike 1/2/4s and many wickets that go for catches.
Impact (IMP): Quantification of a batter's value in runs per ball, explained in further detail here. Intended as an overall measure of player value (think WAR in baseball).
Bowlers
Dot Ball Percent (Dot): Percentage of balls bowled that go for a "dot" (0 runs). Measures a bowler's ability to restrict runs (i.e., their ability to have the other team waste their resources).
The remaining bowler Stats are equivalent to Batter stats with the following adjustments:
Strike Rate is swapped out for Economy (ECON), again a measure of the rate at which a bowler gives up runs.
Balls per Wicket continues to be used here, though is commonly called "bowler's Strike Rate" in the cricket stats community.
Opposition sixes percentage and NBSR are removed.
Batting Results
Stability Measures
First up we'll take a look at batting. The chart below shows the correlation between our two sequential samples for each of the seven batting stats we are interested in. Note that as the # of balls faced increases, we have fewer batters in each sample, which contributes to extra noise in the trends.
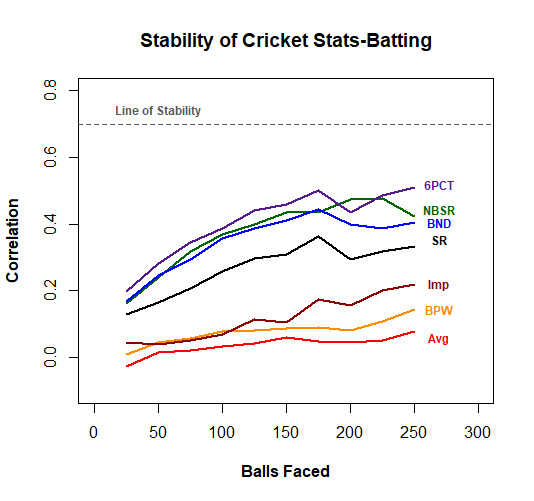
Unfortunately, none of our batting stats get particularly close to the line of stability, but not all is lost! Here is a table outlining each of the stats and their correlation after 250 balls faced.
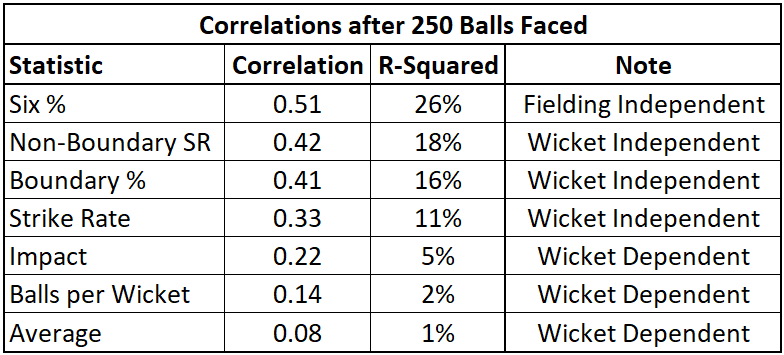
Six percentage comes out to be the most reliable stat, where performance in the previous 250 balls can explain 26% of the variation in performance for the next 250 balls. At first glance, this doesn't appear to be a great story for the predictive value of cricket stats, but there are a few good nuggets in here.
Fielding and Wicket Independence
As noted in the table above, six percentage is largely independent of field settings. If you hit the ball really far, there's nothing the fielders can do to prevent it from being a six-either in terms of how the field is set or the quality of the fielders themselves. Further, NBSR, SR and Boundary % are wicket independent-this means the statistics themselves do not include wickets lost in their calculations.
It was noted earlier that wickets are a relatively rare occurrence, and that rarity introduces a ton of variation into the wicket dependent stats of Impact, Balls per Wicket and Average-making all of these nearly useless for predictive purposes on their own.
All in all, the relative differences between these stats confirm the fact that wickets are an unreliable indicator of player quality, with the wicket independent stats being more predictive of future success.
Predictive vs Explanatory Stability
So far, we've focused on assessing the predictive value of cricket statistics, rather than assessing whether or not a cricket stat reflects the true underlying talent that a player showed for a given window of history. By also testing out the stability of a stat on a purely historical basis, we can gauge how reliably a given stat explains a player's talent level. If we can be more confident of a player's talent level, then we can bring in other factors (i.e., aging curves, stadia at which the player is expected to play in, quality of opposition, etc.) to help aid in predicting that player's future performance based on their historical stats.
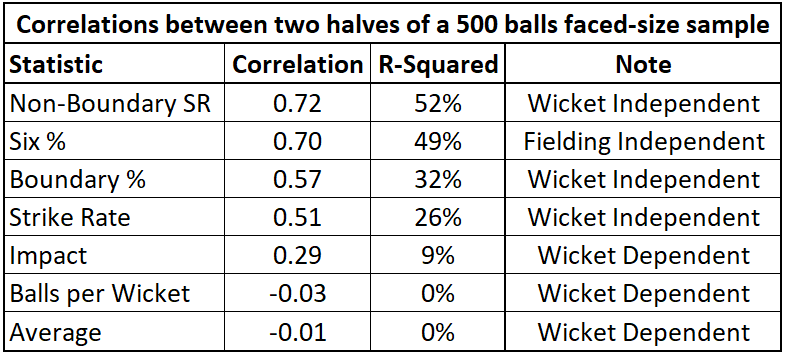
So now we'll replicate our previous analysis-but instead of aiming for sequential periods of time, we'll divide historical samples in half (randomly assigning each ball to one of the two samples) and check correlations between our resulting halves. Here's our new chart and table:
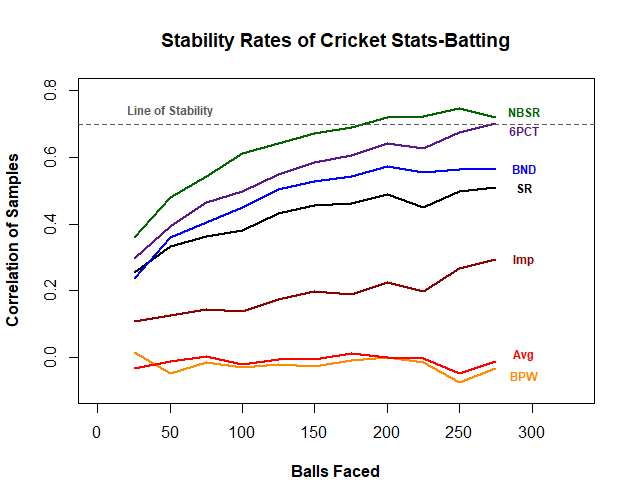
Well hot dog! This is great stuff, with our non-wicket dependent stats showing much improved stability. Both NBSR and Six % meet our previously defined "level of stability", with NBSR doing it after just 175-200 balls faced. Six % makes sense intuitively based on the fielding-independent nature of it. I was a little more surprised by NBSR at first as it would be more fielding-dependent, but it's also a solid measure of a batter's pure speed and aggressiveness between the wickets, so it makes sense here.
Finally, we can compare these results with what we found in our sequential samples. Let's start with Six %: In our sample of 500 historical balls faced, a batter's performance in one half of that sample explains 49% of the variation in their performance in the other half of that sample. But when we take two sequential samples, we're only able to explain 26% of the variation in performance of the second sample.
So what gives? Why do we lose this explicability? The circumstances of that batter's performance is what changes. If you're selecting half a batter's balls from each match, you've got two samples that are pretty similar to each other in terms of where, when and against whom that batter was playing. So for Six %, the circumstances of a player's performance explain 49% - 26% = 23% of the variability in future performance-nearly as much as their previous performance on its own. This is simply a demonstration of the importance of circumstances and context when trying to predict future batting performance.
Bowling Results
Stability Measures
Phew! That was a lot! We’ll move onto bowling now-I’ll spare some of the background explanation here, but there’s still a lot of good insights that differ from what we see on the batting side. First, the results:
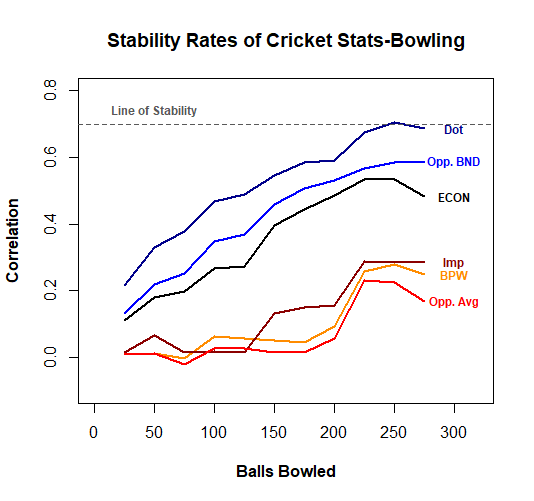
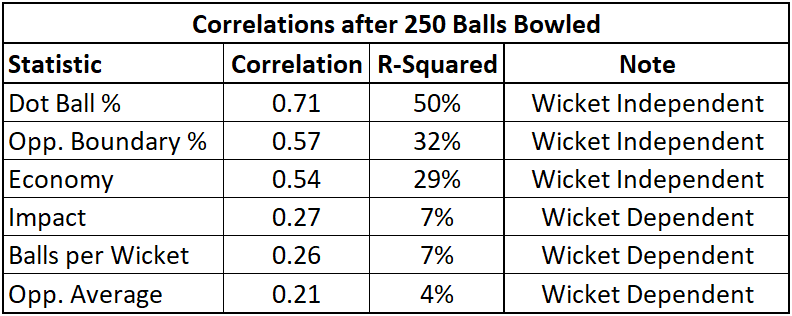
Great success! We have a statistic-an important one at-whose past performance explains 50% of the variation of future performance. Dot Ball % is a rising star in the cricket stats community, with the recognition that each of the 120 balls a batting team faces is itself a precious resource. A bowler that can turn as many of those into dots as possible has incredible value.
Indeed, the three statistics with reasonable stability here are the three that strictly pertain to run management, with the wicket-taking statistics proving less reliable, just as wicket-losing statistics were within the batting stats.
Predictive vs Explanatory Stability
Methodology here is exactly the same as for batting-instead of taking sequential samples, we split up historical data at random into two equal halves and compare correlations. Here are the results:
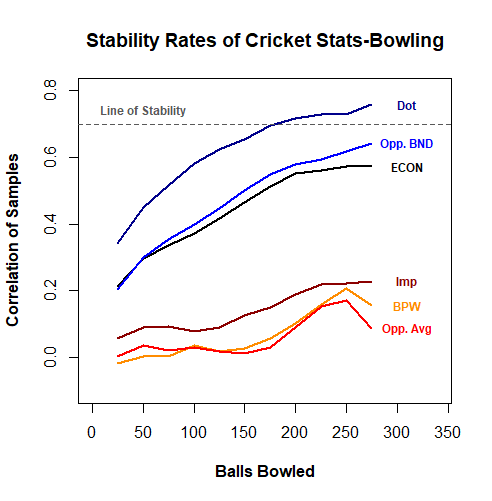
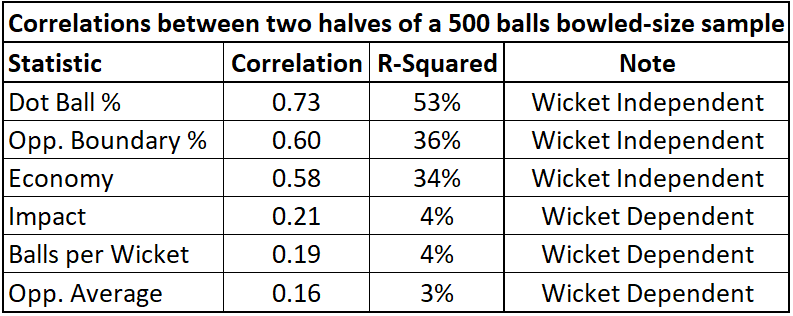
This is quite interesting-if you compare the Correlations between the two bowling tables, the differences are not terribly significant. As a reminder, we saw much weaker stability in our sequential samples with batting stats, indicating that the circumstances of a batter’s playing time were important in determining their final stats. But with bowling, the differences are minimal-and this makes perfect sense!
Bowler usage is explicitly controlled by each team. No matter how well or poorly a bowler does, they can be used for 4 overs, exactly when a team wants to use them-in the powerplay, the middle overs, or at the death. Batters, on the other hand, are beholden to a good amount of random chance-they enter the match when the batters ahead of them get out, which can be at any time, and they only bat as long as they don’t get out themselves. Bad day at the office? They depart after facing just a few balls (if only we could leave at 9:30 during a bad day at work eh?). Having a good day? Here, bat for 50+ balls. Bowler usage is significantly more controlled, meaning the circumstances of past performance and future performance are far more similar, once you control for what league they’re playing in.
Final Thoughts
Well, this has been a fun ride. We made a lot of good discoveries today-stats that involve wicket-taking or wicket-losing are less stable than wicket-independent stats, and wicket-related stats should not be too heavily relied upon to predict future performance. Bowling stats are generally more stable than batting stats, as bowler usage is far more reliable and regular than batter usage. Dot ball percentage for bowlers is the safest cricket stat out there, at least in terms of looking at what a player has done historically and using that to predict what that player will do in the future.
There are limitations to this analysis-I’m only analyzing performance within leagues, that analysis is limited to somewhat arbitrary two-year buckets, we’re not accounting for aging curves, so on and so forth. But I hope that it serves for a reasonable foundation for future exploration. Even with these limitations we were able to find a couple nuggets of truth and demonstrate that further analysis would probably firm up the usefulness of certain cricket statistics.
I hope you enjoyed reading, and please subscribe for more content!
T20 Cricket is a format of cricket where each team bats for one inning, facing 120 balls spread across 20 overs of 6 balls each.
For the math nerds, I'm actually bootstrapping here. If we have a minimum sample size of 50 balls faced/bowled, I'm not simply taking the first 50 balls in each player/year/league combination. I'm allowing taking many samples from each combination, allowing the consecutive sequence of 50 balls to slide along the full sample at random, in order to help boost the accuracy of our figures a little bit and better take advantage of larger samples where available.